Zoonova AI: Morning Market Report – November 3, 2026
Session Quantitative Briefing: The Zoonova AI Intelligence Engine executes a hybrid architecture combining a proprietary Quad-Ensemble machine learning framework with Google Gemini Flash for real-time contextual synthesis and semantic macroeconomic grounding. The quantitative pipeline integrates four specialized estimators: Random Forest Regressor (RFR) for baseline structural stability, eXtreme Gradient Boosting (XGB) optimized for residual loss minimization, Categorical Boosting (CAT) for high-cardinality categorical signal processing, and Temporal Fusion Transformer (TFT) for multi-horizon price and volatility forecasting.
Zoonova AI: Morning Momentum & Liquidity Report
1. QUANTITATIVE MODEL OVERVIEW & SIGNAL METRICS
The Zoonova AI Command Center synthesizes raw macro trend indicators and predictive arrays utilizing Zoonova's Quad-Ensemble, comprising the Random Forest Regressor (RFR), eXtreme Gradient Boosting (XGB), Categorical Boosting (CAT), and Temporal Fusion Transformer (TFT) to project price targets and alpha probabilities. Market sentiment scoring is powered by VADER, evaluating linguistic polarity across news and market commentary. Systemic regime shifts and macro breadth modeling are tracked via BIRCH clustering to detect structural price level and trend anomalies across asset classes.
- SPDR S&P 500 ETF Trust (SPY) closed at $752.10 on 2026-11-02 with a negative sentiment score of -30.0% and annualized volatility of 16.58%, while the Quad-Ensemble model projects a 1-year target of $830.60 by 2027-10-25, representing an implied gain of 10.4% with a 1-year alpha of 0.0% (Zoonova, 2026-11-02).
- Invesco QQQ Trust Series 1 (QQQ) closed at $681.09 on 2026-11-02 with a negative sentiment score of -54.0% and annualized volatility of 22.07%, with long-term projections indicating an 8.1% advance to $736.00 by 2027-10-25 despite an expected 1-year alpha drag of -2.39% (Zoonova, 2026-11-02).
- SPDR Dow Jones Industrial Average ETF (DIA) demonstrated relative near-term strength, closing at $519.34 on 2026-11-02 with a positive sentiment score of +75.0% and annualized volatility of 14.99%, pointing toward a 1-year target of $570.80 by 2027-10-25 for an implied gain of 9.9% and 1-year alpha of -0.54% (Zoonova, 2026-11-02).
- Defensive benchmarks reflect steady capital preservation; Vanguard Total Bond Market ETF (BND) closed at $71.33 on 2026-11-02 with -30.0% sentiment and 4.45% annualized volatility, projecting a 7.5% rise to $76.65 by 2027-10-25, while SPDR Gold Shares ETF (GLD) closed at $361.65 with neutral sentiment of 0.0% and 24.67% annualized volatility, targeting $383.60 by 2027-10-25 for a 6.1% implied gain (Zoonova, 2026-11-02).
- Mega-cap technology equities show divergent trajectories; Apple Inc closed at $338.32 with +80.0% sentiment targeting $360.95 by 2027-10-25 (+6.7% implied gain), Amazon.com Inc. closed at $245.63 with +18.0% sentiment targeting $265.33 (+8.0% implied gain), and Alphabet Inc closed at $279.00 with +84.0% sentiment targeting $305.11 (+9.4% implied gain) (Zoonova, 2026-11-02).
2. SENTIMENT INSIGHTS – TOP 5 HIGH & LOW
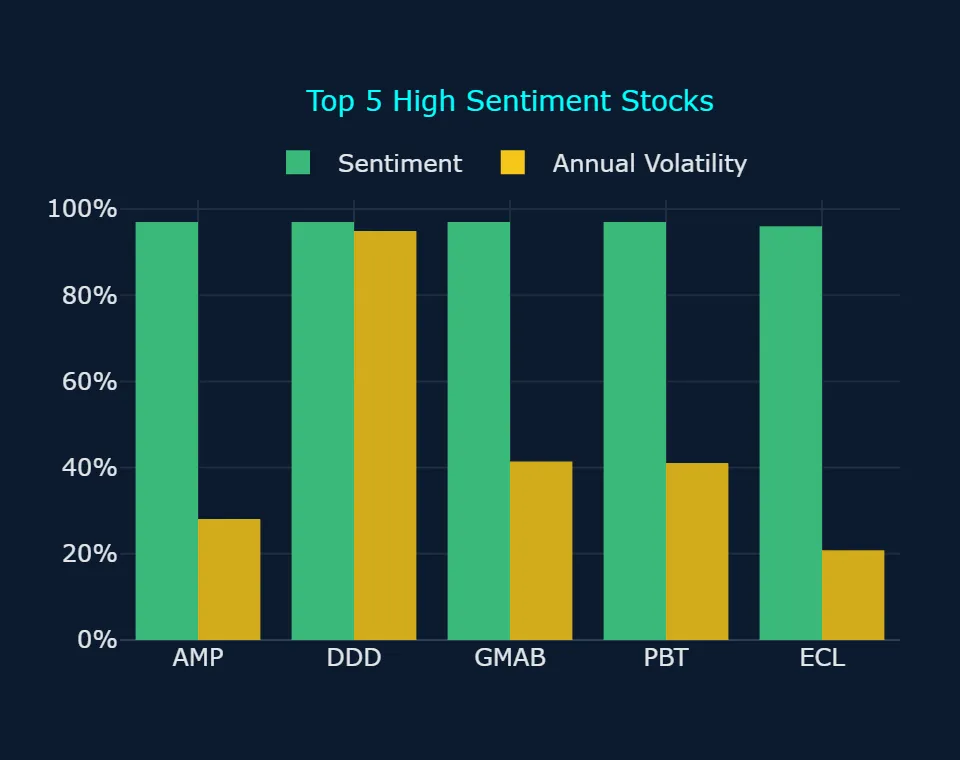
Top 5 High Sentiment Stocks
| Ticker | Company Name | Sentiment Score | Primary Catalyst / Driver |
|---|---|---|---|
| AMP | Ameriprise Financial Inc | +97.0% | Ameriprise Financial reported solid third-quarter adjusted operating revenue and earnings growth driven by strong client asset flows and increased financial advisor productivity (Business Wire, 2026-10-29). |
| DDD | 3D Systems Corp. | +97.0% | 3D Systems expanded its digital dentistry commercial footprint across Europe by partnering with BioSummer Dental following EU MDR certification for its NextDent materials (GlobeNewswire, 2026-11-02). |
| FITB | Fifth Third Bancorp | +97.0% | Fifth Third Bancorp gained positive investor momentum following recognition for wealth management innovation and the announcement of executive presentations at upcoming banking conferences (Business Wire, 2026-10-20). |
| GMAB | Genmab | +97.0% | Genmab shares rallied sharply after reporting that its Phase 3 LiGeR-HN1 clinical trial for petosemtamab met primary endpoints in head and neck cancer (TradingKey, 2026-10-28). |
| PBT | Permian Basin Royalty Trust | +97.0% | Permian Basin Royalty Trust declared an increased monthly cash distribution of $0.045191 per unit and scheduled a unitholder vote regarding a proposed business combination (PR Newswire, 2026-10-20). |
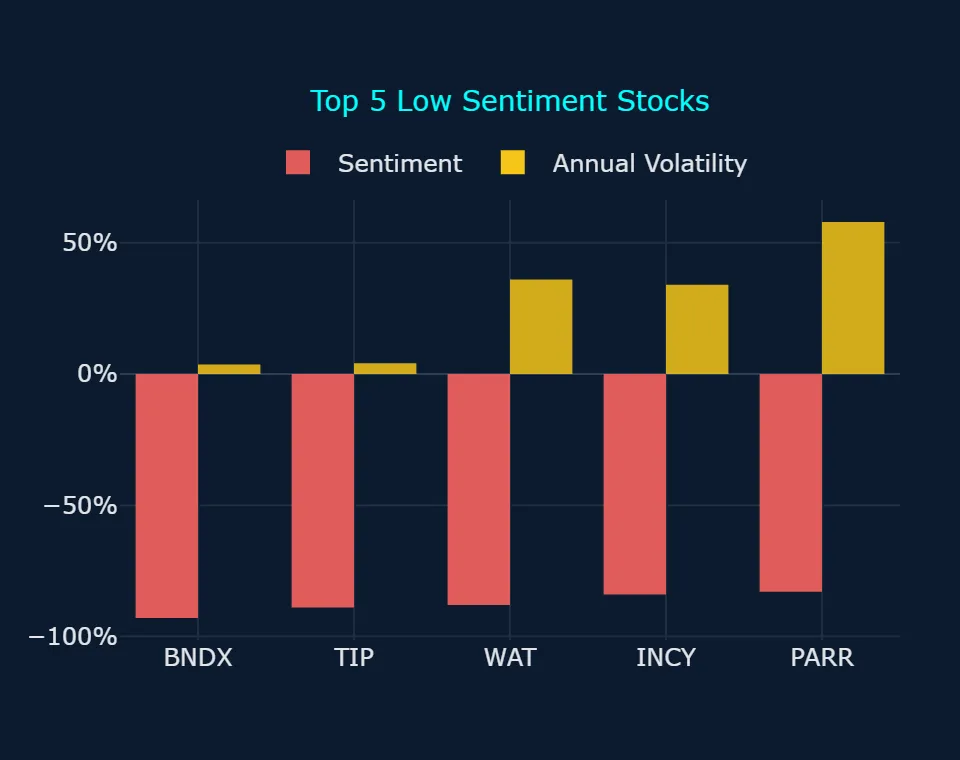
Top 5 Low Sentiment Stocks
| Ticker | Company Name | Sentiment Score | Primary Friction / Risk Factor |
|---|---|---|---|
| BNDX* | Vanguard Total International Bond ETF | -93.0% | Vanguard Total International Bond ETF (BNDX) faced defensive sentiment as global yield disparities and foreign sovereign bond volatility depressed international debt allocations (The Wall Street Journal, 2026-10-22). |
| TIP* | iShares TIPS Bond ETF | -89.0% | The iShares TIPS Bond ETF (TIP) registered weak sentiment as intermediate duration vulnerability and rising real yields offset nominal inflation-hedging demand (ETF Trends, 2026-10-26). |
| WAT | Waters Corp. | -88.0% | Waters Corp. experienced depressed sentiment amid sector-wide caution surrounding biopharma laboratory capital spending ahead of its quarterly report (TradingView, 2026-11-02). |
| MRNA | Moderna Inc | -86.0% | Moderna Inc shares dropped steeply after preliminary cancer vaccine data leaks prompted analyst downgrades and valuation recalibrations (Forbes, 2026-10-22). |
| INCY | Incyte Corp. | -84.0% | Incyte Corp. saw dampened sentiment due to projected quarterly bottom-line losses and notable insider selling activity despite robust underlying product revenue (GuruFocus, 2026-10-28). |
* ETF (exchange-traded fund)
3. ALPHA PROBABILITY & PRICE DELTA LEADERBOARD – 1-YEAR HORIZON
S&P 500 – Top 5 High Alpha Probability (1yr)
| Ticker | Current Price ($) | 1-Yr Target Price ($) | Alpha Probability (%) | Implied Excess Alpha (%) | 10%+ Alpha? |
|---|---|---|---|---|---|
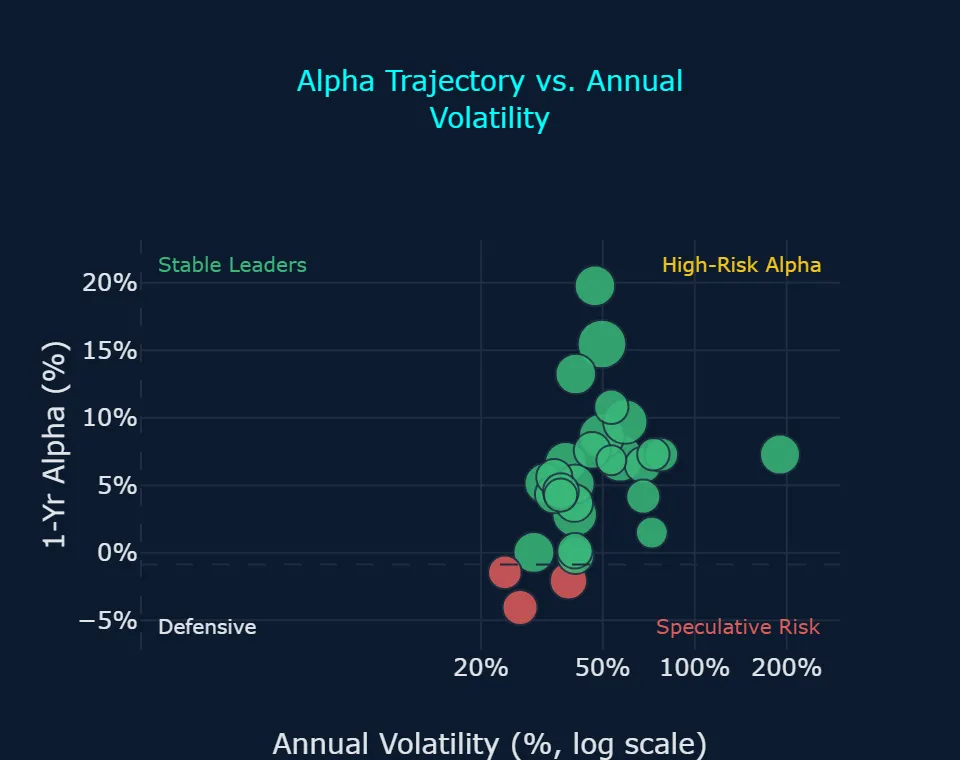
| FISV | $51.93 | $65.44 | 86.40% | 15.57% | Both Yes |
| CPRT | $31.93 | $35.27 | 60.80% | -0.01% | Split |
| ORCL | $119.22 | $143.24 | 59.71% | 9.71% | Split |
| NKE | $39.12 | $45.81 | 52.43% | 6.67% | Split |
| PYPL | $58.78 | $67.08 | 48.64% | 3.68% | Both No |
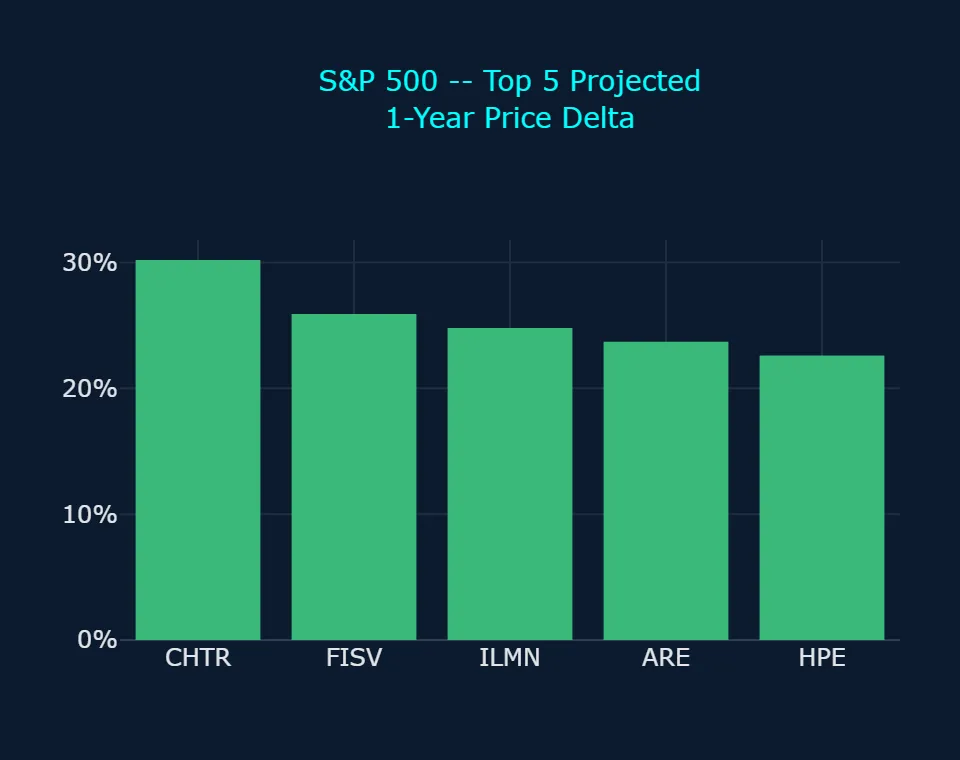
S&P 500 – Top 5 Price Delta + % Change (1yr)
| Ticker | Current Price ($) | 1-Yr Target Price ($) | Absolute Delta ($) | Projected 1-Yr % Change (%) | Implied Excess Alpha (%) |
|---|---|---|---|---|---|
| CHTR | $115.54 | $150.36 | $34.82 | 30.14% | 19.69% |
| FISV | $51.93 | $65.44 | $13.51 | 26.02% | 15.57% |
| ILMN | $226.58 | $283.10 | $56.52 | 24.94% | 14.50% |
| ARE | $42.57 | $52.65 | $10.08 | 23.68% | 13.24% |
| HPE | $51.19 | $62.76 | $11.57 | 22.60% | 12.14% |
NASDAQ 100 – Top 5 High Alpha Probability (1yr)
| Ticker | Current Price ($) | 1-Yr Target Price ($) | Alpha Probability (%) | Implied Excess Alpha (%) | 10%+ Alpha? |
|---|---|---|---|---|---|
| CPRT | $31.93 | $35.27 | 60.80% | -0.01% | Split |
| PYPL | $58.78 | $67.08 | 48.64% | 3.68% | Both No |
| MELI | $1,676.79 | $1,848.53 | 18.74% | -0.20% | Both No |
| NFLX | $62.34 | $71.54 | 17.82% | 4.32% | Both No |
| MRVL | $171.41 | $201.77 | 16.82% | 7.26% | Both No |
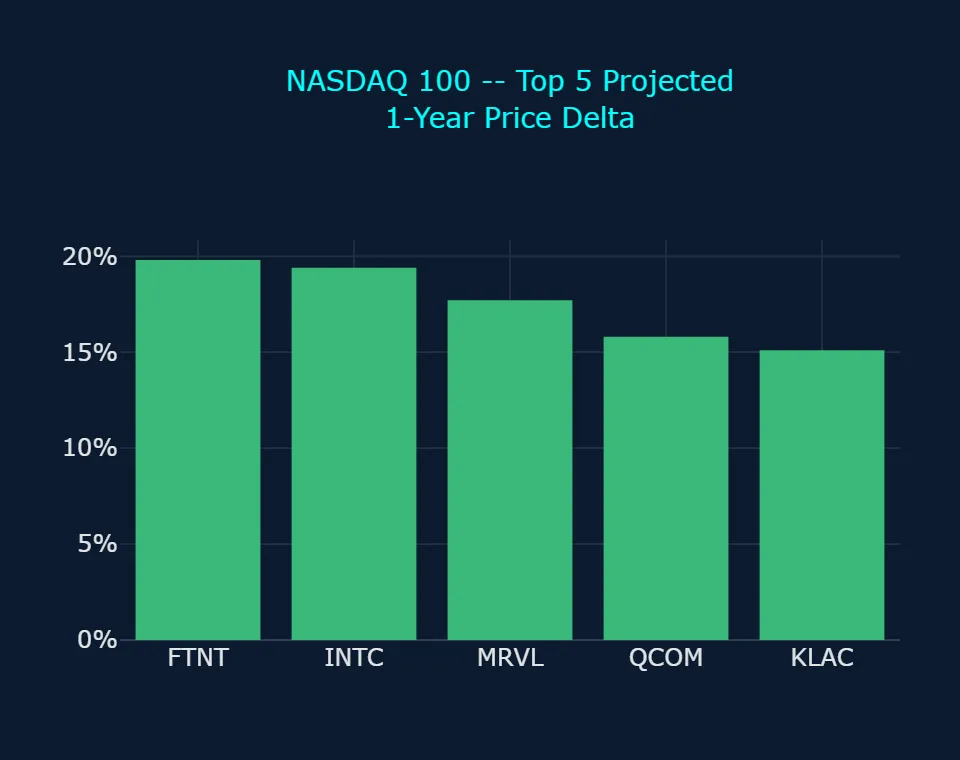
NASDAQ 100 – Top 5 Price Delta + % Change (1yr)
| Ticker | Current Price ($) | 1-Yr Target Price ($) | Absolute Delta ($) | Projected 1-Yr % Change (%) | Implied Excess Alpha (%) |
|---|---|---|---|---|---|
| FTNT | $126.21 | $151.15 | $24.94 | 19.76% | 9.32% |
| INTC | $59.97 | $71.61 | $11.64 | 19.41% | 8.96% |
| MRVL | $171.41 | $201.77 | $30.36 | 17.71% | 7.26% |
| QCOM | $162.08 | $187.65 | $25.57 | 15.78% | 5.34% |
| KLAC | $153.11 | $176.22 | $23.11 | 15.09% | 4.65% |
4. REAL-TIME CONTEXTUAL ENRICHMENT
Broader financial markets have navigated elevated cross-asset volatility driven by geopolitical strains in energy corridors and fluctuating Treasury yields, which notably pressured technology benchmarks including SPDR S&P 500 ETF Trust (SPY) and Invesco QQQ Trust Series 1 (QQQ) (TipRanks, 2026-10-31). This risk-off backdrop is reflected in Zoonova's VADER sentiment metrics, where SPDR S&P 500 ETF Trust (SPY) registered a negative score of -30.0% and Invesco QQQ Trust Series 1 (QQQ) fell to -54.0% as of 2026-11-02 (Zoonova, 2026-11-02). In contrast, high-sentiment single stocks have decoupled from macro headwinds via company-specific operational catalysts, such as Genmab's pivotal oncology readout (TradingKey, 2026-10-28) and Ameriprise Financial's wealth management asset expansion (Business Wire, 2026-10-29).
Within the S&P 500 1-year alpha projections, Fiserv, Inc. (FISV) emerges as the top alpha candidate with an Alpha Probability of 86.40% and a projected 1-year alpha of 15.57%, where both models expect it to beat the benchmark by 10%+ (Zoonova, 2026-11-02). Fiserv confirmed robust operational positioning and expanded efficiency programs ahead of scheduled investor conferences (Fiserv Investor Relations, 2026-10-28). Other top alpha candidates show mixed statistical validation: Copart, Inc. (CPRT) posted an Alpha Probability of 60.80% alongside an implied 1-year alpha of -0.01%, meaning the two models disagree on clearing the 10%+ hurdle. Similarly, Oracle Corp. (ORCL) shows an Alpha Probability of 59.71% with a 1-year alpha of 9.71%, where the two models split, while PayPal Holdings Inc (PYPL) records an Alpha Probability of 48.64% and a 1-year alpha of 3.68%, meaning neither model expects 10%+ outperformance (Zoonova, 2026-11-02).
Zoonova's BIRCH anomaly detection confirms a systemic rotation away from high-beta technology toward cash-flow-resilient equities and defensive cyclicals. A total of 59 names registered bearish anomalies across moderate severity (25 names: 22 stocks, 3 ETFs) and low severity (34 names: 31 stocks, 3 ETFs). The bearish breadth is heavily weighted in semiconductor and enterprise software names, with Advanced Micro Devices Inc., Intel Corp., Micron Technology Inc., and Marvell Technology Inc all confirming concurrent 3-day and 1-week trend anomalies. Concurrently, bullish anomalies remain tightly clustered in select industrials, consumer defensives, and specialty healthcare, including moderate severity (8 stocks) such as Walmart Inc, Cboe Global Markets Inc., and Idexx Laboratories, Inc., confirming an institutional flight to stability over momentum.
5. ANOMALY DETECTION SCANNER
Direction: Bearish
Moderate Severity (25 names: 22 stocks, 3 ETFs)
- AKAM – Akamai Technologies Inc: Bearish Short-Term (3d) Trend Anomaly, Bearish Long-Term (1w) Trend Anomaly
- AMD – Advanced Micro Devices Inc.: Bearish Short-Term (3d) Trend Anomaly, Bearish Long-Term (1w) Trend Anomaly
- CRWD – Crowdstrike Holdings Inc: Bearish Short-Term (3d) Trend Anomaly, Bearish Long-Term (1w) Trend Anomaly
- CSCO – Cisco Systems, Inc.: Bearish Short-Term (3d) Trend Anomaly, Bearish Long-Term (1w) Trend Anomaly
- DDOG – Datadog Inc: Bearish Short-Term (3d) Trend Anomaly, Bearish Long-Term (1w) Trend Anomaly
- FFIV – F5 Inc: Bearish Short-Term (3d) Trend Anomaly, Bearish Long-Term (1w) Trend Anomaly
- FTNT – Fortinet Inc: Bearish Short-Term (3d) Trend Anomaly, Bearish Long-Term (1w) Trend Anomaly
- HPE – Hewlett Packard Enterprise Co: Bearish Short-Term (3d) Trend Anomaly, Bearish Long-Term (1w) Trend Anomaly
- INTC – Intel Corp.: Bearish Short-Term (3d) Trend Anomaly, Bearish Long-Term (1w) Trend Anomaly
- KRYS – Krystal Biotech Inc: Bearish Short-Term (3d) Trend Anomaly, Bearish Long-Term (1w) Trend Anomaly
- MINT* – PIMCO Enhanced Short Maturity Active Exchange-Traded Fund: Bearish Short-Term (3d) Trend Anomaly, Bearish Long-Term (1w) Trend Anomaly
- MRVL – Marvell Technology Inc: Bearish Short-Term (3d) Trend Anomaly, Bearish Long-Term (1w) Trend Anomaly
- MTUM* – iShares MSCI USA Momentum Factor ETF: Bearish Short-Term (3d) Trend Anomaly, Bearish Long-Term (1w) Trend Anomaly
- MU – Micron Technology Inc.: Bearish Short-Term (3d) Trend Anomaly, Bearish Long-Term (1w) Trend Anomaly
- NET – Cloudflare Inc: Bearish Short-Term (3d) Trend Anomaly, Bearish Long-Term (1w) Trend Anomaly
- NTAP – Netapp Inc: Bearish Short-Term (3d) Trend Anomaly, Bearish Long-Term (1w) Trend Anomaly
- NTRA – Natera Inc: Bearish Short-Term (3d) Trend Anomaly, Bearish Long-Term (1w) Trend Anomaly
- OKTA – Okta Inc: Bearish Short-Term (3d) Trend Anomaly, Bearish Long-Term (1w) Trend Anomaly
- PANW – Palo Alto Networks Inc: Bearish Short-Term (3d) Trend Anomaly, Bearish Long-Term (1w) Trend Anomaly
- PGEN – Precigen Inc: Bearish Short-Term (3d) Trend Anomaly, Bearish Long-Term (1w) Trend Anomaly
- SHV* – iShares Short Treasury Bond ETF: Bearish Short-Term (3d) Trend Anomaly, Bearish Long-Term (1w) Trend Anomaly
- STX – Seagate Technology Holdings Plc: Bearish Short-Term (3d) Trend Anomaly, Bearish Long-Term (1w) Trend Anomaly
- TWST – Twist Bioscience Corp: Bearish Short-Term (3d) Trend Anomaly, Bearish Long-Term (1w) Trend Anomaly
- TXG – 10x Genomics Inc: Bearish Short-Term (3d) Trend Anomaly, Bearish Long-Term (1w) Trend Anomaly
- WDC – Western Digital Corp.: Bearish Short-Term (3d) Trend Anomaly, Bearish Long-Term (1w) Trend Anomaly
Low Severity (34 names: 31 stocks, 3 ETFs)
- ADPT – Adaptive Biotechnologies Corp: Bearish Short-Term (3d) Trend Anomaly
- AGIO – Agios Pharmaceuticals Inc: Bearish Long-Term (1w) Trend Anomaly
- ALNY – Alnylam Pharmaceuticals Inc: Bearish Long-Term (1w) Trend Anomaly
- AXSM – Axsome Therapeutics Inc: Bearish Short-Term (3d) Trend Anomaly
- CAT – Caterpillar Inc.: Bearish Long-Term (1w) Trend Anomaly
- CHRW – C.H. Robinson Worldwide, Inc.: Bearish Long-Term (1w) Trend Anomaly
- CRL – Charles River Laboratories International Inc.: Bearish Short-Term (3d) Trend Anomaly
- DVN – Devon Energy Corp.: Bearish Short-Term (3d) Trend Anomaly
- ESLT – Elbit Systems Ltd.: Bearish Short-Term (3d) Trend Anomaly
- GOOG – Alphabet Inc: Bearish Long-Term (1w) Trend Anomaly
- GOOGL – Alphabet Inc: Bearish Long-Term (1w) Trend Anomaly
- HPQ – HP Inc: Bearish Long-Term (1w) Trend Anomaly
- ILMN – Illumina Inc: Bearish Long-Term (1w) Trend Anomaly
- IOVA – Iovance Biotherapeutics Inc: Bearish Long-Term (1w) Trend Anomaly
- JPST* – JPMorgan Ultra-Short Income ETF: Bearish Short-Term (3d) Trend Anomaly
- KEYS – Keysight Technologies Inc: Bearish Long-Term (1w) Trend Anomaly
- KMI – Kinder Morgan Inc: Bearish Short-Term (3d) Trend Anomaly
- LRCX – Lam Research Corp.: Bearish Short-Term (3d) Trend Anomaly
- LSTR – Landstar System, Inc.: Bearish Long-Term (1w) Trend Anomaly
- MPC – Marathon Petroleum Corp: Bearish Short-Term (3d) Trend Anomaly
- NOW – ServiceNow Inc: Bearish Long-Term (1w) Trend Anomaly
- OKE – Oneok Inc.: Bearish Short-Term (3d) Trend Anomaly
- ORCL – Oracle Corp.: Bearish Short-Term (3d) Trend Anomaly
- PLTR – Palantir Technologies Inc: Bearish Long-Term (1w) Trend Anomaly
- PRLB – Proto Labs Inc: Bearish Long-Term (1w) Trend Anomaly
- PTGX – Protagonist Therapeutics Inc: Bearish Short-Term (3d) Trend Anomaly
- SNOW – Snowflake Inc: Bearish Long-Term (1w) Trend Anomaly
- TER – Teradyne, Inc.: Bearish Long-Term (1w) Trend Anomaly
- TT – Trane Technologies plc: Bearish Long-Term (1w) Trend Anomaly
- TWLO – Twilio Inc: Bearish Long-Term (1w) Trend Anomaly
- VGT* – Vanguard Information Technology ETF: Bearish Long-Term (1w) Trend Anomaly
- VLO – Valero Energy Corp.: Bearish Short-Term (3d) Trend Anomaly
- WMB – Williams Cos Inc: Bearish Short-Term (3d) Trend Anomaly
- XLK* – Technology Select Sector SPDR ETF: Bearish Long-Term (1w) Trend Anomaly
Direction: Bullish
Moderate Severity (8 stocks)
- CBOE – Cboe Global Markets Inc.: Bullish Short-Term (3d) Trend Anomaly, Bullish Long-Term (1w) Trend Anomaly
- CBRE – CBRE Group Inc: Bullish Short-Term (3d) Trend Anomaly, Bullish Long-Term (1w) Trend Anomaly
- HEI – Heico Corp.: Bullish Short-Term (3d) Trend Anomaly, Bullish Long-Term (1w) Trend Anomaly
- HWM – Howmet Aerospace Inc: Bullish Short-Term (3d) Trend Anomaly, Bullish Long-Term (1w) Trend Anomaly
- IDXX – Idexx Laboratories, Inc.: Bullish Short-Term (3d) Trend Anomaly, Bullish Long-Term (1w) Trend Anomaly
- PNR – Pentair plc: Bullish Short-Term (3d) Trend Anomaly, Bullish Long-Term (1w) Trend Anomaly
- TPR – Tapestry Inc: Bullish Short-Term (3d) Trend Anomaly, Bullish Long-Term (1w) Trend Anomaly
- WMT – Walmart Inc: Bullish Short-Term (3d) Trend Anomaly, Bullish Long-Term (1w) Trend Anomaly
Low Severity (21 stocks)
- AIR – AAR Corp.: Bullish Short-Term (3d) Trend Anomaly
- AON – Aon plc.: Bullish Long-Term (1w) Trend Anomaly
- EXPE – Expedia Group Inc: Bullish Short-Term (3d) Trend Anomaly
- GE – GE Aerospace: Bullish Short-Term (3d) Trend Anomaly
- GM – General Motors Company: Bullish Long-Term (1w) Trend Anomaly
- GPN – Global Payments, Inc.: Bullish Long-Term (1w) Trend Anomaly
- HII – Huntington Ingalls Industries Inc: Bullish Long-Term (1w) Trend Anomaly
- INSM – Insmed Inc: Bullish Long-Term (1w) Trend Anomaly
- ITW – Illinois Tool Works, Inc.: Bullish Short-Term (3d) Trend Anomaly
- KOD – Kodiak Sciences Inc: Bullish Long-Term (1w) Trend Anomaly
- PHM – PulteGroup Inc: Bullish Short-Term (3d) Trend Anomaly
- PPG – PPG Industries, Inc.: Bullish Long-Term (1w) Trend Anomaly
- PWR – Quanta Services, Inc.: Bullish Long-Term (1w) Trend Anomaly
- RCL – Royal Caribbean Group: Bullish Short-Term (3d) Trend Anomaly
- REGN – Regeneron Pharmaceuticals, Inc.: Bullish Long-Term (1w) Trend Anomaly
- REPL – Replimune Group Inc: Bullish Long-Term (1w) Trend Anomaly
- ROP – Roper Technologies Inc: Bullish Long-Term (1w) Trend Anomaly
- SHW – Sherwin-Williams Co.: Bullish Short-Term (3d) Trend Anomaly
- TDG – Transdigm Group Incorporated: Bullish Short-Term (3d) Trend Anomaly
- TXT – Textron Inc.: Bullish Long-Term (1w) Trend Anomaly
- VMC – Vulcan Materials Co: Bullish Long-Term (1w) Trend Anomaly
* ETF (exchange-traded fund)
6. STRATEGIC INVESTMENT ASSESSMENT
- Underweight high-beta mega-cap technology: In the Tech Stock Scorecard, every single constituent, including Tesla Inc, Alphabet Inc, Apple Inc, Meta Platforms Inc, Microsoft Corporation, Broadcom Inc, Intel Corp., Advanced Micro Devices Inc., Amazon.com Inc., and NVIDIA Corp, carries a Both No outcome, confirming that neither model expects 10%+ benchmark outperformance over a 1-year horizon (Zoonova, 2026-11-02).
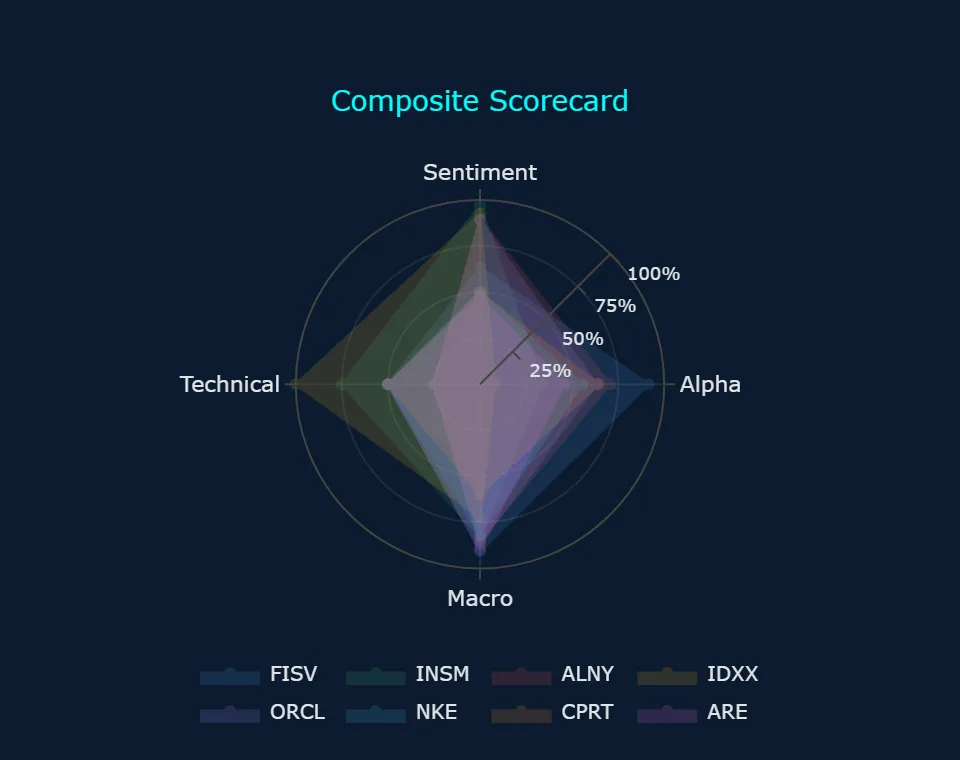
- Overweight top-tier composite leaders with dual-model confirmation: Fiserv, Inc. leads the Main Scorecard with a Composite score of 73.9, supported by an Alpha Rating of 91.4, Macro Alignment of 90.5, and dual-model confirmation where both models expect it to beat the benchmark by 10%+ with zero anomaly flags (Zoonova, 2026-11-02).
- Exercise caution on technology sector breadth: BIRCH anomaly clusters show bearish signals heavily dominating bullish signals by 59 names (53 stocks, 6 ETFs across moderate and low severity) to 29 stocks, with broad tech funds such as Vanguard Information Technology ETF (VGT) and Technology Select Sector SPDR ETF (XLK) registering 1-week bearish trend anomalies.
- Reallocate toward high Macro Alignment and technical breakout names: Main Scorecard selections such as Charter Communications Inc. (Macro Alignment 91.5) and Alexandria Real Estate Equities Inc. (Macro Alignment 89.9), alongside Pentair plc and Idexx Laboratories, Inc. (each holding a top-tier Technical Signal of 100.0), offer resilient risk-adjusted profiles amid prevailing broader market headwinds.
7. STOCK SCORECARD
Main Scorecard
| Ticker | Composite (%) | Alpha Rating | 10%+ Alpha? | Projected 1-Yr Change (%) | Street Consensus (Upside) | Next Earnings | Sentiment Rating | Technical Signal | Macro Alignment | Anomaly Flag | Catalyst / Risk | Market Cap | EPS Revisions (30d) | Short Interest / DTC | Options Flow | Earnings Surprise (4Q) | Bias |
|---|---|---|---|---|---|---|---|---|---|---|---|---|---|---|---|---|---|
| FISV | 73.9% | 91.4 | Both Yes | +26.0% | Hold (+13.6%) | 2026-11-03 (today) | 63.5 | 50.0 | 90.5 | None | Payment Processing Margin | $25.7B | Downward (-3.2%) | 5.3% / 5.2 DTC | Neutral / Mixed | 3/4 Beats | Bullish |
| INSM | 69.8% | 34.0 | Both No | +17.4% | Buy (+79.8%) | 2027-02-19 | 97.0 | 75.0 | 82.9 | Bullish (1w) | Brinsupri Commercial Traction | $20.4B | Upward (+14.2%) | 6.1% / 4.5 DTC | Bullish (Call Skew) | 3/4 Beats | Bullish |
| ALNY | 65.7% | 66.6 | Split | +18.9% | Buy (+93.6%) | 2027-02-11 | 90.0 | 25.0 | 85.0 | Bearish (1w) | Amvuttra Prescription Acceleration | $21.2B | Downward (-4.5%) | 4.8% / 3.9 DTC | Bearish (Put Heavy) | 4/4 Beats (+15.4% avg) | Bullish |
| IDXX | 65.0% | 7.9 | Both No | +13.3% | Buy (+7.4%) | 2027-02-05 | 92.5 | 100.0 | 72.3 | Bullish (3d/1w) | Diagnostic Guidance Boost | $52.9B | Upward (+8.4%) | 2.5% / 2.1 DTC | Bullish (Call Skew) | 4/4 Beats (+6.1% avg) | Bullish |
| NKE | 63.0% | 55.5 | Split | +17.1% | Hold (+4.6%) | 2026-12-17 (in 44d) | 70.0 | 50.0 | 81.9 | None | Direct Channel Turnaround | $57.4B | Downward (-6.1%) | 3.7% / 2.8 DTC | Neutral / Mixed | 2/4 Beats | Neutral |
| PYPL | 57.0% | 51.5 | Both No | +14.1% | Hold (-4.8%) | 2027-02-04 | 55.0 | 50.0 | 76.4 | None | Cost Discipline Turnaround | $47.4B | Upward (+5.1%) | 2.9% / 2.4 DTC | Neutral / Mixed | 3/4 Beats | Neutral |
| ARE | 56.1% | 45.8 | Split | +23.7% | Hold (+16.0%) | 2027-01-25 | 47.5 | 50.0 | 89.9 | None | Life Science Occupancy | $7.0B | Downward (-2.8%) | 4.2% / 3.5 DTC | Neutral / Mixed | 3/4 Beats | Neutral |
| CPRT | 56.1% | 64.3 | Split | +10.5% | Buy (+18.4%) | 2026-11-19 (in 16d) | 50.0 | 50.0 | 59.0 | None | Salvage Volume Moderation | $27.9B | Downward (-1.8%) | 1.9% / 2.6 DTC | Neutral / Mixed | 2/4 Beats | Neutral |
| CHTR | 55.8% | 32.3 | Split | +30.1% | Hold (+62.1%) | 2027-01-29 | 61.5 | 50.0 | 91.5 | None | Broadband Subscriber Losses | $26.1B | Downward (-4.1%) | 8.5% / 6.2 DTC | Bearish (Put Heavy) | 2/4 Beats | Neutral |
| PNR | 55.7% | 7.8 | Both No | +15.6% | Buy (+4.3%) | 2027-02-01 | 50.0 | 100.0 | 79.3 | Bullish (3d/1w) | Pool Channel Recovery | $10.6B | Neutral/Flat (0.0%) | 2.1% / 1.8 DTC | Bullish (Call Skew) | 3/4 Beats | Neutral |
| NOW | 55.3% | 29.2 | Split | +21.3% | Buy (+44.6%) | 2027-01-27 | 91.0 | 25.0 | 87.7 | Bearish (1w) | Enterprise SaaS Deceleration | $110.0B | Downward (-3.4%) | 2.9% / 2.5 DTC | Bearish (Put Heavy) | 4/4 Beats (+4.8% avg) | Neutral |
| ORCL | 55.0% | 63.2 | Split | +20.1% | Buy (+76.6%) | 2026-12-14 (in 41d) | 50.0 | 25.0 | 86.4 | Bearish (3d) | Cloud Infrastructure Capex | $374.1B | Downward (-2.5%) | 1.8% / 1.9 DTC | Bearish (Put Heavy) | 3/4 Beats | Neutral |
| REPL | 54.7% | 10.2 | Both No | +17.7% | Buy (+14.6%) | 2026-11-12 (in 9d) | 65.0 | 75.0 | 83.4 | Bullish (1w) | RP1 Regulatory Resubmission | $1.9B | N/A (Pre-Revenue) | 14.2% / 6.5 DTC | Bullish (Call Skew) | 3/4 Beats | Neutral |
| CHRW | 52.5% | 22.5 | Both No | +15.6% | Buy (+40.7%) | 2027-02-03 | 94.5 | 25.0 | 79.5 | Bearish (1w) | Freight Margin Normalization | $14.4B | Upward (+3.2%) | 4.5% / 3.1 DTC | Neutral / Mixed | 3/4 Beats | Neutral |
| ROP | 46.3% | 5.9 | Both No | +6.4% | Buy (-2.7%) | 2027-01-26 | 97.5 | 75.0 | 7.2 | Bullish (1w) | Software Compounding Discipline | $46.2B | Upward (+2.1%) | 1.6% / 2.4 DTC | Bullish (Call Skew) | 4/4 Beats (+3.2% avg) | Neutral |
| ESLT | 44.1% | 6.0 | Both No | +10.6% | Buy (+5.7%) | 2026-11-24 (in 21d) | 95.5 | 25.0 | 60.9 | Bearish (3d) | Defense Order Backlog | $34.8B | Upward (+5.8%) | 1.2% / 1.5 DTC | Neutral / Mixed | 4/4 Beats (+6.5% avg) | Neutral |
| MELI | 41.9% | 19.8 | Both No | +10.2% | Buy (+28.2%) | 2026-11-05 (in 2d) | 48.5 | 50.0 | 56.7 | None | Fintech Credit Expansion | $85.0B | Upward (+4.2%) | 2.1% / 2.0 DTC | Neutral / Mixed | 3/4 Beats | Neutral |
| MU | 41.3% | 12.5 | Both No | +11.9% | Buy (+14.0%) | 2026-12-17 (in 44d) | 96.0 | 0.0 | 67.9 | Bearish (3d/1w) | Memory Pricing Cyclicality | $943.1B | Downward (-5.2%) | 3.1% / 2.2 DTC | Bearish (Put Heavy) | 4/4 Beats (+8.4% avg) | Neutral |
| WDC | 28.9% | 26.5 | Both No | +14.6% | Hold (-71.9%) | 2027-01-28 | 22.0 | 0.0 | 77.1 | Bearish (3d/1w) | Storage Cyclical Reset | $126.7B | Downward (-8.7%) | 4.9% / 3.4 DTC | Bearish (Put Heavy) | 3/4 Beats | Bearish |
| KMI | 23.5% | 7.0 | Both No | +9.0% | Buy (+15.3%) | 2027-01-20 | 30.5 | 25.0 | 37.6 | Bearish (3d) | Natural Gas Infrastructure | $75.4B | Upward (+3.5%) | 1.7% / 2.9 DTC | Neutral / Mixed | 4/4 Beats (+2.8% avg) | Bearish |
10%+ Alpha? – whether Zoonova's two 1-year models (alpha probability and price target) expect the stock to beat the benchmark by 10%+. “Both No” is common: 10% is a high bar.
Tech Stock Scorecard
| Ticker | Composite (%) | Alpha Rating | 10%+ Alpha? | Projected 1-Yr Change (%) | Street Consensus (Upside) | Next Earnings | Sentiment Rating | Technical Signal | Macro Alignment | Anomaly Flag | Catalyst / Risk | Market Cap | EPS Revisions (30d) | Short Interest / DTC | Options Flow | Earnings Surprise (4Q) | Bias |
|---|---|---|---|---|---|---|---|---|---|---|---|---|---|---|---|---|---|
| TSLA | 39.7% | 0.6 | Both No | +8.2% | Hold (-5.9%) | 2027-01-27 | 87.0 | 50.0 | 26.3 | None | Automotive Margin Stability | $1.58T | Upward (+3.1%) | 3.2% / 1.8 DTC | Neutral / Mixed | 3/4 Beats | Bearish |
| GOOGL | 39.3% | 3.9 | Both No | +9.4% | Buy (+11.1%) | 2027-02-02 | 92.0 | 25.0 | 44.4 | Bearish (1w) | Search Infrastructure Spending | $3.44T | Downward (-3.0%) | 1.0% / 1.5 DTC | Bearish (Put Heavy) | 3/4 Beats | Bearish |
| AAPL | 37.4% | 1.1 | Both No | +6.7% | Buy (+7.9%) | 2027-01-28 | 90.0 | 50.0 | 10.3 | None | Component Input Costs | $5.03T | Upward (+2.4%) | 0.9% / 1.4 DTC | Neutral / Mixed | 4/4 Beats (+3.1% avg) | Bearish |
| META | 37.0% | 5.9 | Both No | +9.8% | Buy (+12.1%) | 2027-01-27 | 50.0 | 50.0 | 50.9 | None | Negative Cash Flow | $1.58T | Downward (-4.2%) | 1.3% / 1.6 DTC | Bearish (Put Heavy) | 3/4 Beats | Bearish |
| MSFT | 36.1% | 0.6 | Both No | +6.0% | Buy (+10.4%) | 2027-01-26 | 90.0 | 50.0 | 4.3 | None | AI Capital Expenditure | $3.88T | Neutral/Flat (0.0%) | 0.8% / 1.2 DTC | Neutral / Mixed | 4/4 Beats (+4.0% avg) | Bearish |
| AVGO | 35.4% | 4.0 | Both No | +9.5% | Strong Buy (+19.5%) | 2026-12-10 (in 37d) | 50.0 | 50.0 | 46.2 | None | Custom Silicon Growth | $1.50T | Upward (+2.8%) | 1.5% / 1.9 DTC | Bullish (Call Skew) | 4/4 Beats (+5.5% avg) | Bearish |
| INTC | 35.1% | 4.1 | Both No | +19.4% | Hold (+54.6%) | 2027-01-21 | 67.0 | 0.0 | 85.5 | Bearish (3d/1w) | Client PC Demand Slump | $395.0B | Downward (-12.4%) | 4.1% / 2.3 DTC | Bearish (Put Heavy) | 2/4 Beats | Bearish |
| AMD | 33.8% | 4.2 | Both No | +12.0% | Buy (+30.1%) | 2026-11-03 (today) | 75.5 | 0.0 | 68.2 | Bearish (3d/1w) | Data Center Helios Ramp | $818.0B | Downward (-1.5%) | 2.4% / 1.7 DTC | Bearish (Put Heavy) | 3/4 Beats | Bearish |
| AMZN | 32.2% | 0.9 | Both No | +8.0% | Buy (+16.0%) | 2027-01-28 | 59.0 | 50.0 | 23.5 | None | Cloud Free Cash Flow | $2.60T | Downward (-2.1%) | 1.1% / 1.3 DTC | Neutral / Mixed | 3/4 Beats | Bearish |
| NVDA | 29.5% | 0.9 | Both No | +7.9% | Strong Buy (+21.3%) | 2026-11-18 (in 15d) | 50.0 | 50.0 | 21.3 | None | Hyperscale Capex Scrutiny | $4.93T | Neutral/Flat (0.0%) | 1.2% / 1.1 DTC | Neutral / Mixed | 4/4 Beats (+7.2% avg) | Bearish |
| SPCX | N/H | N/H | N/A | N/A | Buy | 2027-02-25 | N/H | N/H | N/H | None | Starlink Revenue Expansion | $1.83T | Upward (+15.0%) | 3.5% / 2.0 DTC | Bullish (Call Skew) | 3/4 Beats | N/A |
N/H: no ML scores yet (insufficient trading history for the models).
Search-grounded columns (Street Consensus (Upside), Next Earnings, Catalyst / Risk, Market Cap, EPS Revisions (30d), Short Interest / DTC, Options Flow, Earnings Surprise (4Q)): MarketBeat, TradingKey, CNN, Barchart, Investing.com, The Motley Fool, Finviz, Moomoo, Seeking Alpha, Zacks, Slickcharts, TipRanks, Stock Analysis, Morningstar (sources dated 2026-10-30 to 2026-11-03).
Educational purposes only. Not investment advice.
Zoonova AI: Morning Technical Analysis Report
Zero index constituents achieve universal HIGH indicator status as absence of top-tier Chaikin Money Flow caps broader technical breadth.
1. 6 CORE INDICATORS
Indicator levels (LOW / MEDIUM / HIGH) and % Cluster come from Zoonova's BIRCH model (Balanced Iterative Reducing and Clustering using Hierarchies), an unsupervised machine-learning clustering model used for pattern recognition. Each indicator is clustered across the stock universe; % Cluster is the centroid of the cluster a stock falls in.
| Indicator | Category | Role |
|---|---|---|
| ARUPAroon Up | Trend Direction | Recency of the highest high in the lookback window; collapses in bear markets, so HIGH means price keeps printing fresh swing highs. |
| +DIPositive Directional Indicator | Trend Direction | Upward directional movement relative to true range; unlike ADX it collapses in sell-offs, so HIGH confirms buyer-driven expansion. |
| MFIMoney Flow Index | Volume / Inflow | Volume-weighted RSI from 0 to 100; falls as money leaves on down days, so HIGH means inflow on up days outweighs outflow. |
| CMFChaikin Money Flow | Volume / Inflow | Close location within the bar weighted by volume; plunges negative in liquidation, so HIGH confirms sustained buying into the top of daily ranges. |
| TSITrue Strength Index | Momentum | Double-smoothed momentum from -100 to +100; deeply negative in downtrends, so HIGH shows consistent multi-period upward thrust. |
| UOUltimate Oscillator | Momentum | Buying pressure across 7-, 14- and 28-period windows from 0 to 100; sinks when closes sit near the lows, so HIGH means buyers are in control on every timeframe. |
2. TECHNICAL REGIME
| Index | Universe | All HIGH (6/6) | Avg HIGH | Aroon Up HIGH | +DI HIGH | MFI HIGH | CMF HIGH | TSI HIGH | UO HIGH |
|---|---|---|---|---|---|---|---|---|---|
| S&P 500 | 424 | 0 | 2.0/6 | 319 | 133 | 121 | 0 | 150 | 105 |
| NASDAQ 100 | 71 | 0 | 1.4/6 | 37 | 19 | 10 | 0 | 16 | 16 |
Across 424 S&P 500 stocks, the average HIGH count is 2.0 with 0 stocks with all indicators HIGH, led by Aroon Up at 319 members but 0 at HIGH for Chaikin Money Flow. The NASDAQ 100 exhibits lower participation across 71 members with an average HIGH count of 1.4, where 0 stocks hold all indicators HIGH and Aroon Up leads at 37.
3. TOP 5 BULLISH CONFLUENCE
Ranking: Rank = HIGH count (#1 = 6/6, #2 = 5/6, ...); within a rank, Sentiment (desc), then ticker. Sentiment only orders tickers within a rank; it is not a technical signal.
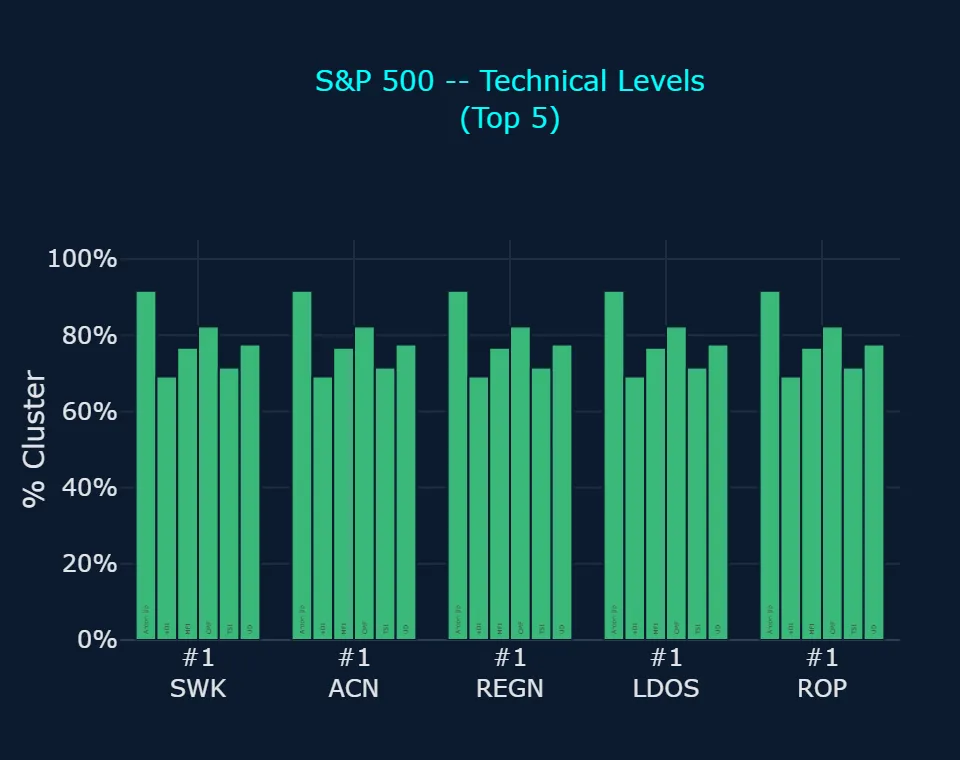
S&P 500 – Top 5 Bullish Confluence
| Rank | Ticker | Aroon Up | +DI | MFI | CMF | TSI | UO | HIGH | Sentiment |
|---|---|---|---|---|---|---|---|---|---|
| 2 | ROP | HIGH 91.7% | HIGH 63.2% | HIGH 81.4% | MEDIUM 6.1% | HIGH 71.5% | HIGH 77.1% | 5/6 | +95.0% |
| 2 | FTV | HIGH 91.7% | HIGH 63.2% | HIGH 81.4% | MEDIUM 6.1% | HIGH 71.5% | HIGH 77.1% | 5/6 | +94.0% |
| 2 | WEC | HIGH 91.7% | HIGH 63.2% | HIGH 81.4% | MEDIUM 6.1% | HIGH 71.5% | HIGH 77.1% | 5/6 | +92.0% |
| 2 | DOW | HIGH 91.7% | HIGH 63.2% | HIGH 81.4% | MEDIUM 6.1% | HIGH 71.5% | HIGH 77.1% | 5/6 | +91.0% |
| 2 | SWK | HIGH 91.7% | HIGH 63.2% | HIGH 81.4% | MEDIUM 6.1% | HIGH 71.5% | HIGH 77.1% | 5/6 | +91.0% |
S&P 500 – Signal Groups
| Rank | Ticker | Trend Direction | Volume / Inflow | Momentum |
|---|---|---|---|---|
| 2 | ROP | 2 of 2 HIGH | 1 of 2 HIGH | 2 of 2 HIGH |
| 2 | FTV | 2 of 2 HIGH | 1 of 2 HIGH | 2 of 2 HIGH |
| 2 | WEC | 2 of 2 HIGH | 1 of 2 HIGH | 2 of 2 HIGH |
| 2 | DOW | 2 of 2 HIGH | 1 of 2 HIGH | 2 of 2 HIGH |
| 2 | SWK | 2 of 2 HIGH | 1 of 2 HIGH | 2 of 2 HIGH |
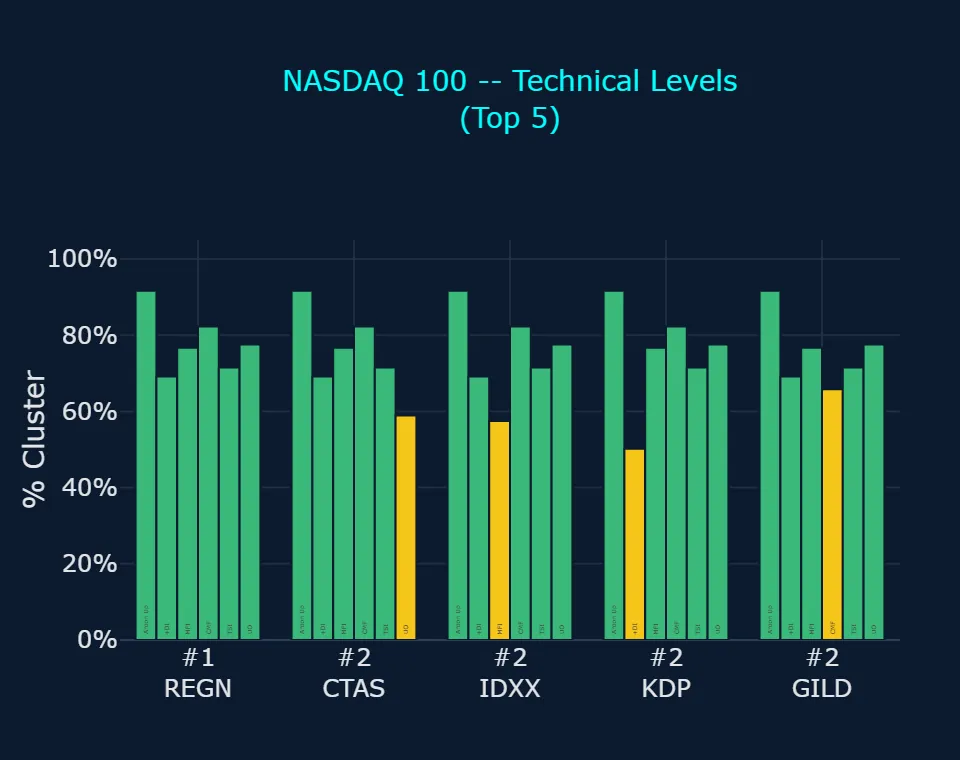
NASDAQ 100 – Top 5 Bullish Confluence
| Rank | Ticker | Aroon Up | +DI | MFI | CMF | TSI | UO | HIGH | Sentiment |
|---|---|---|---|---|---|---|---|---|---|
| 2 | EXC | HIGH 91.7% | HIGH 63.2% | HIGH 81.4% | MEDIUM 6.1% | HIGH 71.5% | HIGH 77.1% | 5/6 | +87.0% |
| 2 | REGN | HIGH 91.7% | HIGH 63.2% | HIGH 81.4% | MEDIUM 6.1% | HIGH 71.5% | HIGH 77.1% | 5/6 | +80.0% |
| 2 | KDP | HIGH 91.7% | HIGH 63.2% | HIGH 81.4% | MEDIUM 6.1% | HIGH 71.5% | HIGH 77.1% | 5/6 | +74.0% |
| 3 | IDXX | HIGH 91.7% | HIGH 63.2% | MEDIUM 60.6% | MEDIUM 6.1% | HIGH 71.5% | HIGH 77.1% | 4/6 | +85.0% |
| 3 | SBUX | HIGH 91.7% | MEDIUM 38.4% | HIGH 81.4% | MEDIUM 6.1% | HIGH 71.5% | HIGH 77.1% | 4/6 | +71.0% |
NASDAQ 100 – Signal Groups
| Rank | Ticker | Trend Direction | Volume / Inflow | Momentum |
|---|---|---|---|---|
| 2 | EXC | 2 of 2 HIGH | 1 of 2 HIGH | 2 of 2 HIGH |
| 2 | REGN | 2 of 2 HIGH | 1 of 2 HIGH | 2 of 2 HIGH |
| 2 | KDP | 2 of 2 HIGH | 1 of 2 HIGH | 2 of 2 HIGH |
| 3 | IDXX | 2 of 2 HIGH | 0 of 2 HIGH | 2 of 2 HIGH |
| 3 | SBUX | 1 of 2 HIGH | 1 of 2 HIGH | 2 of 2 HIGH |
4. TICKER READS
S&P 500
- #2 ROP – 5 of 6 indicators at HIGH, supported by Trend Direction 2 of 2 HIGH and Momentum 2 of 2 HIGH alongside Money Flow Index at HIGH. Chaikin Money Flow remains at MEDIUM, leaving Volume / Inflow at 1 of 2 HIGH against Sentiment of +95.0% and a Mixed verdict. Scorecard support is tempered by Macro Alignment of 7.2 despite a Technical Signal of 75.0. Watch: Chaikin Money Flow to reach HIGH to complete indicator alignment.
- #2 FTV – 5 of 6 indicators at HIGH, underpinned by Trend Direction 2 of 2 HIGH and Momentum 2 of 2 HIGH with Money Flow Index also at HIGH. Chaikin Money Flow remains at MEDIUM, keeping Volume / Inflow at 1 of 2 HIGH alongside Sentiment of +94.0% for a Mixed verdict. The setup shows balanced Scorecard metrics with Macro Alignment at 52.4 and a neutral Technical Signal of 50.0. Watch: Chaikin Money Flow to reach HIGH to validate institutional buying.
- #2 WEC – 5 of 6 indicators at HIGH, capturing full agreement across Trend Direction 2 of 2 HIGH and Momentum 2 of 2 HIGH alongside Money Flow Index at HIGH. A Divergent verdict emerges as the Scorecard Composite sits at 39.4, weighed down by an Alpha Rating of 0.2 and Macro Alignment of 14.0 despite Sentiment of +92.0%. Chaikin Money Flow remains at MEDIUM, leaving Volume / Inflow at 1 of 2 HIGH. Watch: Macro Alignment to lift above 14.0 to resolve composite divergence.
- #2 DOW – 5 of 6 indicators at HIGH, with Trend Direction 2 of 2 HIGH and Momentum 2 of 2 HIGH confirming buyer control alongside Money Flow Index at HIGH. Chaikin Money Flow holds at MEDIUM, keeping Volume / Inflow at 1 of 2 HIGH with Sentiment at +91.0% under a Mixed verdict. Scorecard Composite reaches 47.7, assisted by Macro Alignment at 54.2 with Technical Signal neutral at 50.0. Watch: Chaikin Money Flow to achieve HIGH to confirm broad accumulation.
- #2 SWK – 5 of 6 indicators at HIGH, led by Trend Direction 2 of 2 HIGH and Momentum 2 of 2 HIGH while Money Flow Index registers at HIGH. Chaikin Money Flow sits at MEDIUM to leave Volume / Inflow at 1 of 2 HIGH alongside Sentiment of +91.0% for a Mixed verdict. Scorecard Composite stands at 49.9, backed by Macro Alignment of 65.8 against a neutral Technical Signal of 50.0. Watch: Chaikin Money Flow rising to HIGH to push Composite past 50.0.
NASDAQ 100
- #2 EXC – 5 of 6 indicators at HIGH, demonstrating strength across Trend Direction 2 of 2 HIGH and Momentum 2 of 2 HIGH with Money Flow Index at HIGH. A Divergent verdict is assigned as the Scorecard Composite of 43.9 conflicts with strong technicals, pressured by Macro Alignment at 25.9 despite an Alpha Rating of 9.5 and Sentiment of +87.0%. Chaikin Money Flow remains at MEDIUM, keeping Volume / Inflow at 1 of 2 HIGH. Watch: Macro Alignment to expand above 25.9 to resolve divergence.
- #2 REGN – 5 of 6 indicators at HIGH, securing a Confirmed verdict as a Scorecard Composite of 55.2 aligns with robust technical readings. Trend Direction 2 of 2 HIGH and Momentum 2 of 2 HIGH reflect solid momentum alongside Money Flow Index at HIGH and Sentiment of +80.0%. The profile is reinforced by a Bullish (1w) Technical Signal of 75.0, with only Chaikin Money Flow at MEDIUM. Watch: Chaikin Money Flow to reach HIGH for full indicator alignment.
- #2 KDP – 5 of 6 indicators at HIGH, supported by Trend Direction 2 of 2 HIGH and Momentum 2 of 2 HIGH alongside Money Flow Index at HIGH. The setup carries a Divergent verdict because the Scorecard Composite of 41.5 reflects weak Macro Alignment at 23.8 despite an Alpha Rating of 8.2 and Sentiment of +74.0%. Volume / Inflow remains capped at 1 of 2 HIGH with Chaikin Money Flow at MEDIUM. Watch: Macro Alignment to lift above 23.8 to support technical expansion.
- #3 IDXX – 4 of 6 indicators at HIGH, led by Trend Direction 2 of 2 HIGH and Momentum 2 of 2 HIGH, yielding a Mixed verdict. Volume / Inflow shows 0 of 2 HIGH as both Money Flow Index and Chaikin Money Flow reside at MEDIUM. The stock displays the highest Scorecard Composite at 65.0, propelled by a Bullish (3d/1w) Technical Signal of 100.0, Sentiment of +85.0%, and Macro Alignment of 72.3. Watch: Money Flow Index to elevate to HIGH to confirm capital inflow.
- #3 SBUX – 4 of 6 indicators at HIGH, capturing Momentum 2 of 2 HIGH and Money Flow Index at HIGH, producing a Mixed verdict. Trend Direction is limited to 1 of 2 HIGH with Positive Directional Indicator at MEDIUM, while Chaikin Money Flow also holds at MEDIUM. The Scorecard Composite registers at 43.7 alongside Sentiment of +71.0% and Macro Alignment of 48.5. Watch: Positive Directional Indicator to reach HIGH for trend strength.
5. TECHNICAL VS. COMPOSITE MODEL CHECK
Composite is the Zoonova Scorecard (0-100), normalized across the full universe: 30% Alpha (1-year probability of beating the benchmark by 10%+), 25% Sentiment, 25% Technical (bullish minus bearish anomaly flags; 50 = none) and 20% Macro (1-year alpha percentile).
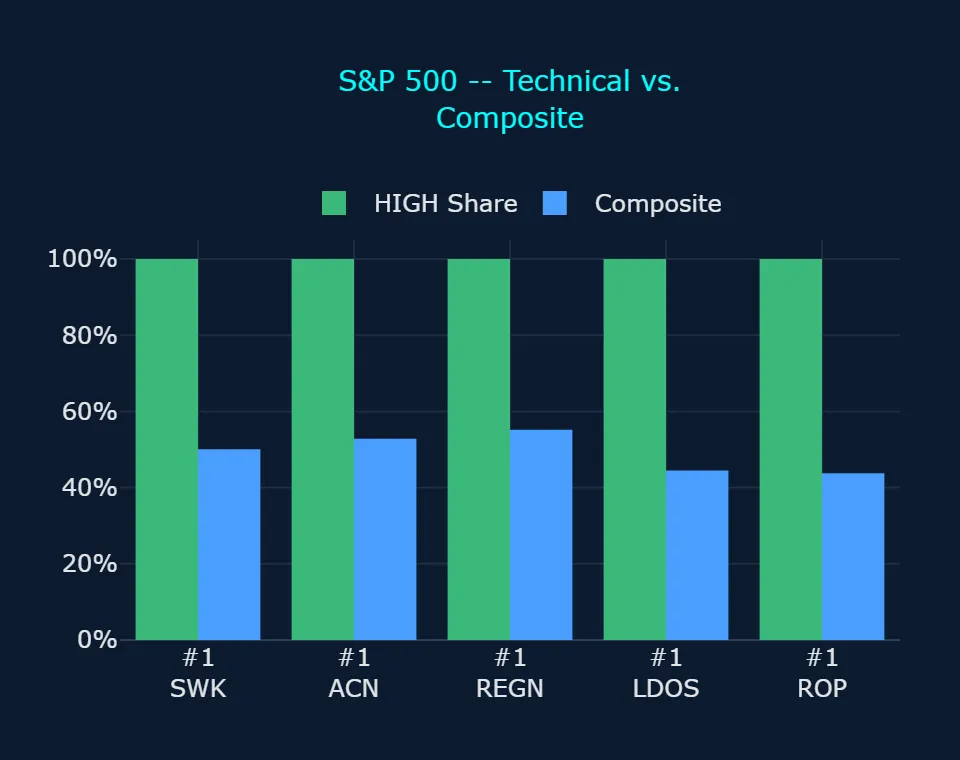
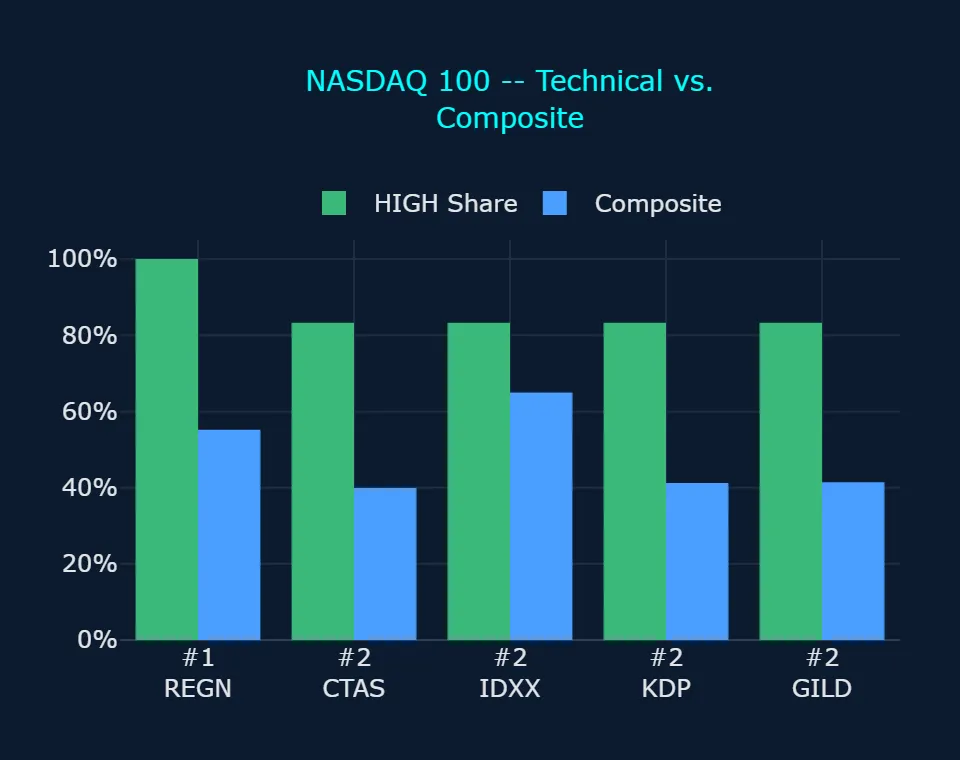
Verdict: Confirmed = strong technicals (HIGH share 75% or more) with Composite 55 or more; Divergent = one strong and the other weak (strong technicals with Composite below 45, or weak technicals, HIGH share below 50%, with Composite 55 or more); Weak = both weak; otherwise Mixed.
S&P 500 – Technical vs. Composite
| Rank | Ticker | HIGH | Composite | Verdict |
|---|---|---|---|---|
| 2 | ROP | 5/6 | 46.3% | Mixed |
| 2 | FTV | 5/6 | 47.3% | Mixed |
| 2 | WEC | 5/6 | 39.4% | Divergent |
| 2 | DOW | 5/6 | 47.7% | Mixed |
| 2 | SWK | 5/6 | 49.9% | Mixed |
NASDAQ 100 – Technical vs. Composite
| Rank | Ticker | HIGH | Composite | Verdict |
|---|---|---|---|---|
| 2 | EXC | 5/6 | 43.9% | Divergent |
| 2 | REGN | 5/6 | 55.2% | Confirmed |
| 2 | KDP | 5/6 | 41.5% | Divergent |
| 3 | IDXX | 4/6 | 65.0% | Mixed |
| 3 | SBUX | 4/6 | 43.7% | Mixed |
- WEC: WEC shows strong technicals with 5 of 6 indicators at HIGH, but holds a Divergent verdict due to a low Scorecard Composite of 39.4 driven by Macro Alignment of 14.0 and Alpha Rating of 0.2.
- EXC: EXC carries a Divergent verdict as 5 of 6 indicators at HIGH contrast with a Scorecard Composite of 43.9, restrained by Macro Alignment of 25.9.
- KDP: KDP generates a Divergent verdict because robust technicals of 5 of 6 indicators at HIGH conflict with a Scorecard Composite of 41.5 and Macro Alignment of 23.8.
6. TECHNICAL CONTEXT
- REGN – Regeneron reported Q3 2026 financial results on 2026-10-30 with revenues rising 36% to $5.1 billion. (GlobeNewswire, 2026-10-30)
- FTV – Fortive reported Q3 2026 results on 2026-10-28 and raised its full-year adjusted EPS guidance. (Business Wire, 2026-10-28)
- IDXX – Idexx Laboratories registered Bullish Short-Term (3d) and Bullish Long-Term (1w) Trend Anomalies under Moderate Severity. (Zoonova, 2026-11-02)
- ROP – Roper Technologies registered a Bullish Long-Term (1w) Trend Anomaly under Low Severity. (Zoonova, 2026-11-02)
7. TECHNICAL ASSESSMENT
The broader technical posture is characterized by selective upside momentum and swing highs, yet remains constrained by a universal deficit in Chaikin Money Flow across all 433 constituents. While names like REGN achieve confirmed technical backing and IDXX shows dual-timeframe bullish trend anomalies, the primary risk stems from low volume-weighted accumulation and weak macro alignment across divergent defensive leaders.
Educational purposes only. Not investment advice.